 Say you took out a college loan for $20,000. Being a loan, you'd need to pay the money back. One possible way of slowly paying the money back would be to pay $125.99 a month, taking you approximately 20 years to pay off. However, one thing to consider would be the effect of interest rate, which is around 4.45%. This means you'd need to add around $4,494 to your initial loan, leaving you to pay about $30,237.60, considering you are paying $125.99 a month. The amount of money you would have to pay really depends on the interest rate, and whether or not the interest rate is high or low. This isn't necessarily surprising, however, it concerns me that student loans can take so long to pay off. It is such an unnecessary burden.
0 Comments
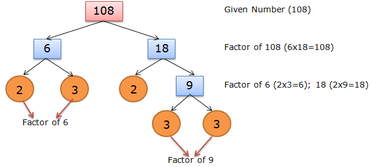 Zeros and factors are tied quite tightly together; in fact, zeros and factors are nearly the same thing, however, after you find the zeros of a graph, you must flip the sign (negative or positive) and put the zeros in full factor form. Although this is true most of the time, things can get tricky when divide a polynomial and get one straight answer. This answer often times can be divided down into more than one factor, which in turn, makes it easier for us to write down the factors. Long division is not the only way we are able to collect the zeros of a graph. Another form of division is called synthetic. Synthetic division makes it easier to find zeros that are not easy to find, by taking the zeros that ARE easy to find, and dividing them out until you get a quadratic.
One question you might have that can make finding the number of zeros kind of difficult is a question regarding the number of zeros you are meant to find. Sometimes, the problem you are doing will not give you the number of zeros they want you to find, however, an easy way of fixing this is to look at the degree of the exponent. If the first x for is example, is risen to the 5th power, that is the number of zeros you should be able to come up with. 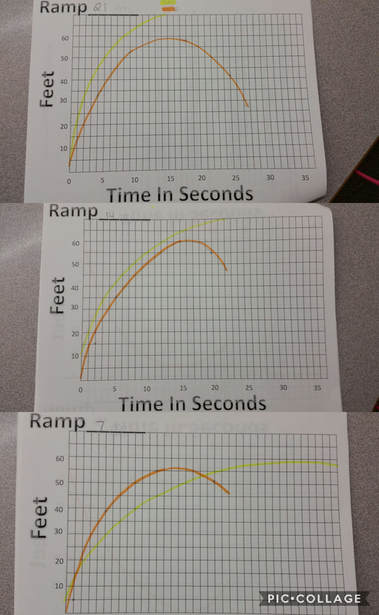 In class, we were asked to do an assignment pertaining to the relationship between height, distance, and time. These factors were to be represented by a skateboard travelling down a ramp.
Before we were to fully analyze the actual values of the "experiment", we were required to make predictions based on what we thought a graph would look like, had it represented the relationship between time and distance of a 21 inch drop, a 14 inch drop, and a 7 inch drop. My predictions were as follows: The slope for the 21 inch drop would be steeper than that of the 14 inch and 7 inch drops. The reasoning behind this estimate is from previous observation of everyday physics. A car for example tends to speed up when going down a steep hill, but manages to stay at a steady rate when going down a minor slope. Now to compare my expectations to reality. Before the video started, I did not realize that the graphs were meant to form a 'U' shape, however, the lack of zeros can still be compared to the zeros of the actual information. For my guessing, I was not expecting the skateboard to roll back, leaving my visible graphs a exponential representations. However, when I went back to put the actual zeros down, I noticed that the graphs all hit a maximum. Not only did they all hit a maximum, but their maximums were rather close, only differing by a few feet. (Note: My drawn in graphs look very similar, but I do understand the difference that should be properly shown). Another thing the graphs had in common were the points at which they rose the fastest, which was to be the point at which they were initially dropped. My assumption for why this occurred is based upon my basic knowledge of, once again, physics! When the skateboard is initially dropped, it has built up momentum, and as it gets further away from the ramp, the momentum starts to dwindle. 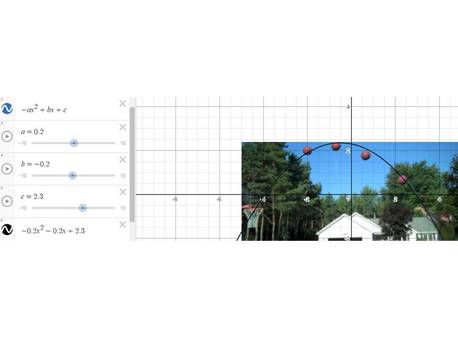 According to the graph, the ball will eventually make it into the hoop.
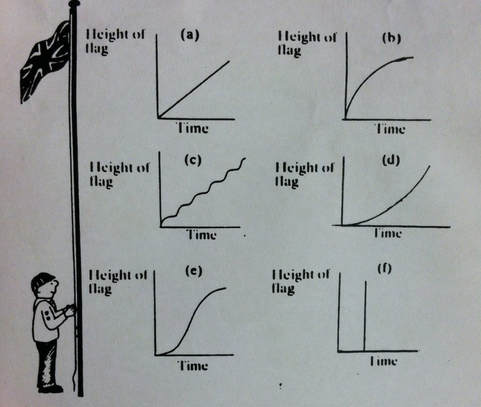 Every morning, a young boy scout is required to raise a flag at the summer camp he is attending. To the left, a series of graphs shows the rate at which the boy hoists the flag. In graph (a), it is evident that the boy is raising the flag at a steady rate, for the height of the flag stays consistent with the time it takes to lift it. In graph (b), however, things begin to change. In this graph. the boy begins by steadily hoisting the flag, but as time drags on, the boy slows down in his raising speed. Next on the list is graph (c). This graph shows the boy taking frequent breaks during the hoisting process. After the boy has taken a few moments to raise the flag, he takes a break, and this pattern persists throughout the graph, causing a "snake-like" shape. When moving on to graph (d), we can see that the relationship between the height of the flag and the time it takes to raise the flag presents an exponential growth. This means, as time goes by, the boy begins to lift the flag faster. Graph (e) is very similar to the previous graph. As time goes by, the boy speeds up the hoisting, but as you notice, the rate at which the boy raises the flag plateaus midway through the graph. Finally, graph (f) can be compared to graph (a) in that it is the complete opposite. Instead of a steady rise, the boy takes quite a bit of time to get started, but once he starts, it is clear that he does not stop. This situation is the least realistic, for it is impossible for a person to hoist a flag at that rate. The most realistic, however, would be graph (a), a steady hoist in order to get the desired end result.
|
AuthorWrite something about yourself. No need to be fancy, just an overview. Archives
November 2017
Categories |
 RSS Feed
